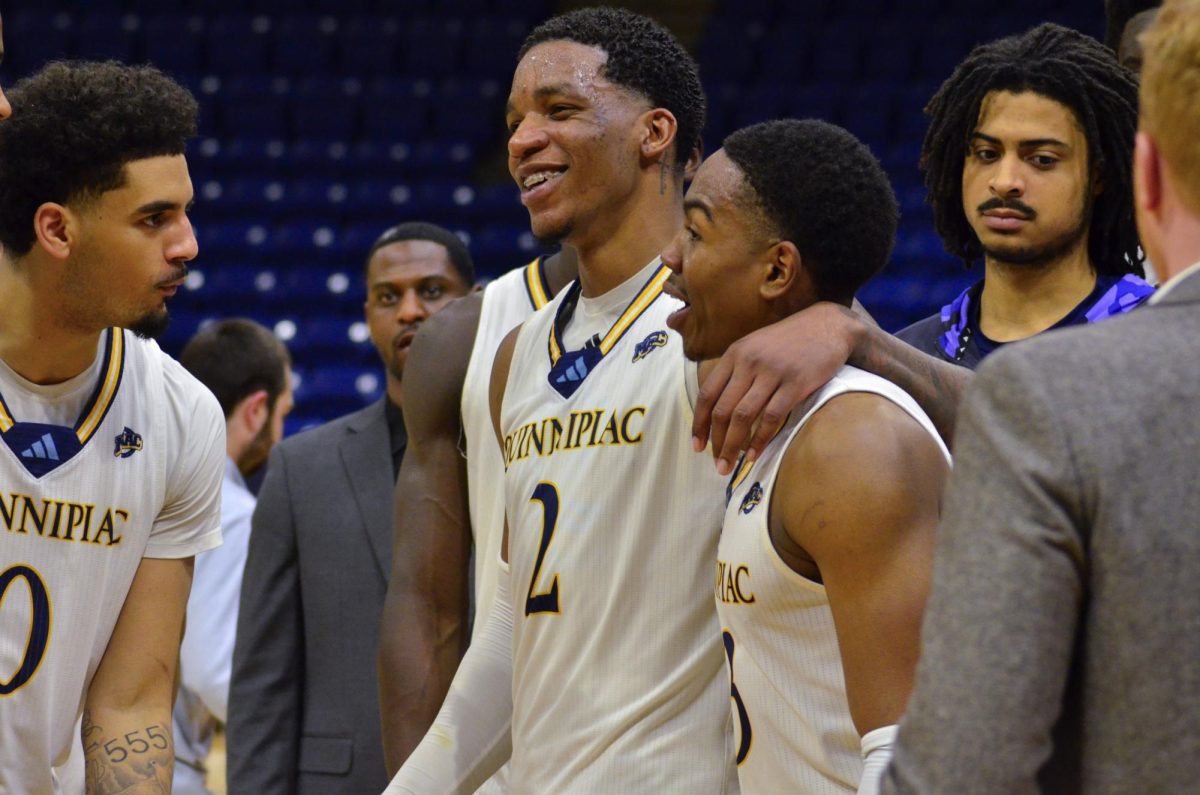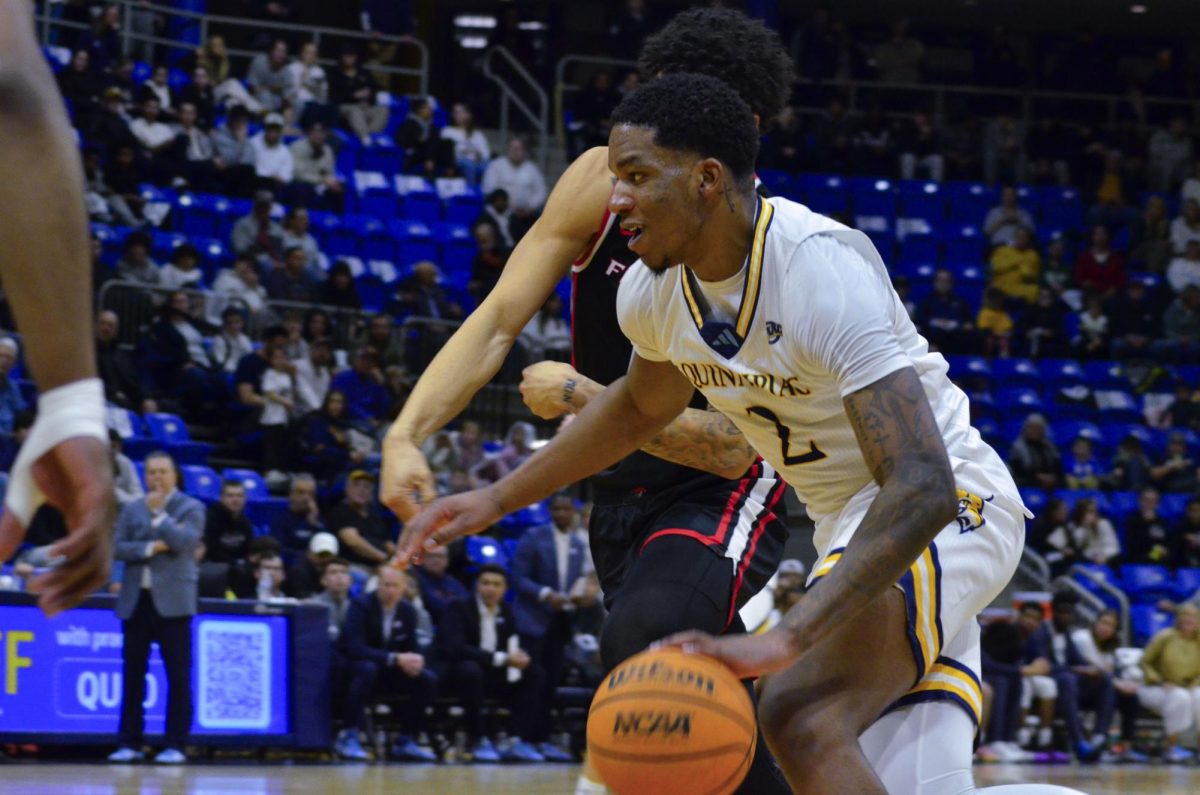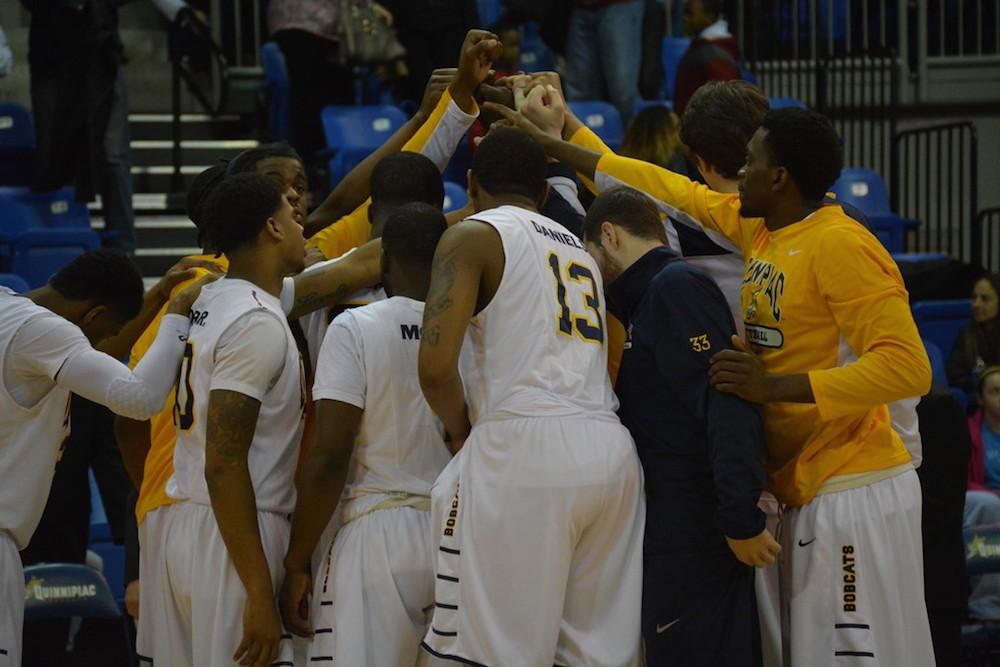
The No. 9 Quinnipiac men’s basketball team was unable to advance past the first round of the MAAC Tournament for the second consecutive year after dropping a 60-57 contest to the No. 8 Rider Broncs on Thursday.
The loss officially ends Quinnipiac’s season with a 9-21 overall record and a 6-14 split in MAAC play. The Bobcats’ nine regular-season wins are the fewest since the 2003-04 season when Joe DeSantis was at the helm of the program.
It was also just the second time in the Tom Moore era that the Bobcats ended the regular season with a sub-.500 record.
So where did things go wrong for the Bobcats?
Inside the arc
Quinnipiac’s offense wasn’t just bad—it was historically bad. The Bobcats’ 38.3 percent mark from two-point range, which ranks dead last among all 351 Division I teams, is the worst two-point shooting percentage of any Division I team since the 2003-04 season (Arkansas Pine Bluff and Army finished at 37.6 percent and 37 percent, respectively).
The Bobcats were even worse during conference play, shooting 37.5 percent on shots inside the arc.
Opponents blocking shots played a substantial role in Quinnipiac’s woeful offense. The “block percentage” statistic measures what percentage of two-point field goals the defense blocked. In Quinnipiac’s case, that number was 9.8 percent overall and 10.2 percent in conference play.
While that number may not seem significant at first, take Quinnipiac’s game against Monmouth on Jan. 9 as an example. In that game, the Bobcats attempted 50 two-point shots.
First, round 9.8 percent up to an even 10 percent to make things easier. Since 10 percent of 50 is five, one would expect that the Hawks blocked five of Quinnipiac’s 50 two-pointers. Check the box score because that’s exactly what happened.
Blocks work against you in two ways. First, it means that your shot didn’t go in. The second reason is that blocks often result in fast breaks for the opposition.
In the aforementioned game versus Monmouth, the Hawks’ Chris Brady blocked Ayron Hutton’s shot which turned into a fast-break layup for Monmouth’s MAAC Player of the Year Justin Robinson.
In that same half, Brady blocked a jumper by James Ford, Jr. The result was a Quinnipiac foul and two successful free throws for Micah Seaborn.
Brady blocked yet another shot in the second half and while Josh James missed the layup attempt, Brady corralled the offensive rebound and scored himself.
In those three cases, Monmouth blocks essentially acted as Quinnipiac turnovers because it allowed the Hawks to get out in transition offense.
Of course, the players bear some responsibility as well.
Senior Giovanni McLean and sophomore Chaise Daniels, the two players who posted the highest usage rates on the team, both finished under 40 percent from two-point range (usage rate takes a player’s field goal attempts, free-throw attempts and turnovers to measure how often that player is responsible for what happened during a possession).
Guards Dimitri Floras and Hutton both had issues making jumpers and finishing in the lane.
Floras finished the year shooting 24.6 percent on two-point shots while Hutton shot an even 20 percent.
Free-throw line
The free-throw line was another area of concern for Moore’s squad. The Bobcats went from first to last in the MAAC after shooting 77.1 percent from the charity stripe last season, but only 66.8 percent this season.
One could make the argument that Quinnipiac’s inability to get to the free-throw line was more detrimental to the offense than the team’s poor shooting percentage when they got there.
That’s because the Bobcats averaged less than one point per possession in 20 of the teams’ 29 games.
If you replaced every possession from those 20 games with two free-throw attempts and Quinnipiac managed to make 50 percent of them, the Bobcats would’ve scored more points than they did.
Let’s go back to Quinnipiac’s first game of the season against Sacred Heart.
The Bobcats lost 76-64 and shot 32.8 percent from the field with 80 possessions in the game. If you take Quinnipiac’s 64 points and divide that by 80 possessions, you get 0.8 points per possession.
Now imagine that on all 80 possessions Quinnipiac was awarded two free throws.
For the sake of simplicity, let’s say that all 80 times, Player A missed the first free throw and made the second. That means despite shooting 50 percent from the free-throw line, the Bobcats would average one point per possession.
If you already forgot, that would be 0.2 more points per possession than what actually happened in the game.
If Sacred Heart’s offense played exactly the same, the Bobcats would have won the game 80-76 instead of losing 76-64.
Including the game against Sacred Heart, there were seven games that Quinnipiac lost in which making one free throw on each possession would have been more efficient than the team’s actual production.
The term “free throw rate” measures how often a team attempts a free throw compared to how many shots it takes by dividing the former by the latter.
The Bobcats attempted conference-low 370 free throws during regular season MAAC games.
Unsurprisingly, the Bobcats had the worst free throw rate in the conference and finished in the bottom 10 in the country.
Quinnipiac’s free throw percentage (64.7 percent, 329th in Division I) and free throw rate (28.0 percent, 342nd in Division I) amounted to 17.5 percent (313th in Division I) of Quinnipiac’s total points this season coming from the free-throw line. [toggle title=”Click here for a more in-depth analysis of the free throw rate.”] If you still don’t think getting to the line is all that important, consider this.
Quinnipiac attempted 1,898 field goals this season, which amounts to approximately 63 shots per game.
By using Quinnipiac’s 28 percent free throw rate, which means the team attempts 28 free throws per 100 shots, the Bobcats took about 18 free throws per game.
The Bobcats would score nine points per game from the free-throw line if they were shooting at 50 percent.
If the Bobcats were accurate 80 percent of the time, that would amount to 14 points per game, a noticeable five-point difference. So a 30 percent increase in accuracy would lead to roughly a 56 percent increase in scoring.
Alternatively, let’s say Quinnipiac increased its free throw rate from 28 percent to 50 percent.
With a 32 percent increase, they’d now take about 31 free-throw attempts per game instead of 18.
If the team shoots 50 percent, that would be about 15 points. Despite shooting 30 percent worse, that still amounts to one more point than shooting 80 percent with 18 free-throw attempts.
If the Bobcats moved a little closer to reality and shot 70 percent from the free-throw line with the same 50 percent free throw rate, that would be almost 22 points.
The point is you can compensate for being a poor free-throw shooting team by taking a surplus of free throws. Unfortunately for the Bobcats, they attempted the fewest free throws in the league and made the lowest percentage of them.
[/toggle]
Lack of transition points
Moore said during the press conference after Quinnipiac’s thrilling 56-55 win over Saint Peter’s that his team doesn’t take many risks defensively.
That’s not necessarily a bad thing. The Bobcats were actually among some of the best defensively. Quinnipiac allowed opponents to shoot 31 percent from deep, the 21st best mark in the country for a defensive unit.
The team also finished in the top 100 in opponent two-point shooting percentage, block percentage and effective field goal percentage (eFG%, your basic field goal percentage but adjusted for the fact that a three-point is worth one more point than a two-pointer.)
The Bobcats were great at preventing teams from hitting shots from deep by hedging on shooters on pick-and-rolls, closing out and communicating when help defense was needed.
For the most part, Quinnipiac was able to stay grounded on pump fakes and contested when a defender was in the area.
However, Moore’s crew finished second-to-last in the MAAC in turnover and steal percentages.
“Defense wins championships” is something sports fans say quite frequently, but a defense can’t win a championship if it doesn’t lead to offense.
Without forcing turnovers or coming up with steals, Quinnipiac couldn’t get out on the fast break. That meant the Bobcats had to rely on its half court offense, which if you’ve read this far, you know wasn’t great.
The Bobcats were also a middle-of-the-pack team when it came to blocked shots, which was a focal point in recent years with Ousmane Drame and Ike Azotam. This was the first season in which the Bobcats didn’t finish in the top five in block percentage in its respective conference since 2012-13.
With so few turnovers, steals and blocked shots, transition points were hard to come by. Had the team gotten a few more, that two-point shooting percentage might have gone up.
Offensive inefficiency
The Bobcats finished out the season averaging 91.6 points per 100 possessions, which was good enough for 338th in the country.
Aside from missing a lot of shots and not getting to the free-throw line, Quinnipiac turned the ball over on 21.7 percent of its possessions, more often than 336 other teams.
Generally speaking, players who have a higher usage rate (players who touch the ball more) tend to have higher turnover rates. The more a player has the ball in their hands, the more that player will turn the ball over.
While McLean and Daniels posted the highest usage rates for Quinnipiac and had higher turnover rates than the average player, Moore’s squad had seven players in the top 50 for turnover percentage with Hutton sliding in with the fifth-worst rate in the conference.
Finally, player efficiency rating (PER) is a statistic that has made its way to professional basketball, but is rarely used at the collegiate level. In short, it rewards players for good stats like points, assists and rebounds, but punishes players for bad stats like turnovers and fouls.
While the stat isn’t perfect and there are some players who manage to achieve a high PER simply due to limited minutes, it does provide a good basis for the types of players that comprise a time.
Monmouth’s Robinson finished with a 26.5 PER, the highest in the conference. Scores are then organized into different levels, with Robinson’s score falling under the “MVP-caliber” player.
Quinnipiac only had three players above the “average player” tier: Daniel Harris (16.6), Donovan Smith (15.9) and Abdulai Bundu (15.7).
Unfortunately, all three players fall under the “good third option” tier.
To say this was a disappointing season for Moore and company would be an understatement.
A year after losing the entire starting lineup, there simply wasn’t enough offense for the Bobcats to be a legitimate threat.
Aside from question marks surrounding McLean, the roster will remain relatively unchanged.
Graduate transfer Will Simonton had minimal impact, but the team will miss Ford Jr.’s effort on the defensive end. Moore will have to hope his upcoming recruiting class can have an instant impact in 2016-17.
Otherwise, it’ll be much of the same next year for the Bobcats.


